Mastering Crypto Technical Analysis: A Comprehensive Guide

Technical analysis is becoming more and more popular in the cryptocurrency market as traders look for ways to get ahead in a market that is very unpredictable and changes quickly.
What is Technical Analysis?

Technical analysis is a way to study the financial markets by using charts and other tools to look at past market data, mostly price and volume data, to find patterns, trends, and possible price moves. Technical analysis is based on the idea that the way prices moved in the past can give clues about how prices will move in the future.

Technical analysts think that the price and volume data of a financial asset show everything important about the market, and technical analysis can be used to find market trends, levels of support and resistance and possible buy and sell signals.
How does Technical Analysis work?

Now that we know what technical analysis is, let’s explore how technical analysis work in the cryptocurrency market.

Technical analysis is based on the idea that supply and demand is what drives the market, and that changes in these factors are reflected in price and volume data. Technical analysts analyze this data using charts and other tools to spot patterns and trends that can be used to predict future price movements.
The chart is one of the most important tools in technical analysis.
What is a Chart in Technical Analysis?
A chart is a visual display of price and volume data over a given period of time. Line charts, bar charts, and candlestick charts are just a few of the chart types utilized in technical analysis.

The most basic sort of chart, a line chart displays the closing price of a financial asset over a predetermined time period.
Bar charts display a financial assets’ opening, closing, high, and low prices over a chosen time frame.
Candlestick charts, which are similar to bar charts, offer more details regarding price trends and movements.
What are Indicators in Technical Analysis?

Various indicators are also used by technical analysts to analyze market data and spot patterns and trends. Indicators are mathematical calculations based on price and volume data that are used to identify potential buy and sell signals.
Moving averages, the relative strength index (RSI), and stochastic oscillators are just a few of the different types of indicators that are utilized in technical analysis.
Moving averages are used to spot trends by smoothing out price data over a specified period of time.
The stochastic oscillator is used to spot potential trend reversals, while the RSI is used to spot overbought and oversold market conditions.

How is Technical Analysis Applied in the Cryptocurrency Market?
The supply and demand, news and various events, regulatory developments, and market dynamics all play a role in how volatile and quickly changing the cryptocurrency market is.
Technical analysts in the crypto market can use technical analysis to spot trends, levels of support and resistance, and potential buy and sell signals.
One of the key benefits of technical analysis in the crypto market, is its ability to identify trends.
Trends are important in the cryptocurrency market because they can provide valuable information about potential price movements. For example, if a cryptocurrency is experiencing an uptrend, it might be a good time to buy, while if it is experiencing a downtrend, it might be a good time to sell.

In the cryptocurrency market, it is also important to be able to identify support and resistance levels using technical analysis.

Support levels are price levels at which buying pressure is expected to overcome selling pressure, while resistance levels are price levels at which selling pressure is expected to overcome buying pressure.
Identifying these levels can help technical analysts make informed decisions about buying and selling.
For instance, it can be a good idea to sell a cryptocurrency if there is a bearish divergence, in which the price is heading up while the RSI is trending down.
However, if a cryptocurrency is experiencing a bullish divergence – that is, when the price is heading down while the RSI is trending up – it can be a good idea to buy.

There are several other technical analysis methods that are widely used in the cryptocurrency market in addition to these fundamental technical analysis tools and indicators.
These include chart patterns, Fibonacci retracements, and Elliott wave analysis.
What is Elliott wave?
Elliott wave analysis is a method of analyzing market cycles that involves identifying repeating patterns of price movements.
This analysis is based on the theory that markets move in waves, with each wave representing a specific phase of the market cycle. By identifying these waves, technical analysts can decide whether it is time to buy or sell.

What are Fibonacci retracements?
Another popular technical analysis method in the crypto market is Fibonacci retracements.
This analysis is based on the Fibonacci sequence, a mathematical sequence of numbers in which each number is the sum of the two preceding numbers.
Technical analysts use Fibonacci retracements to identify potential support and resistance levels.

What are Chart Patterns?
Another often used tool in technical analysis on the crypto market is chart patterns.
Among others, these patterns include triangles, double tops and bottoms, and head and shoulders.
These patterns can provide valuable information about potential price movements and can help technical analysts make informed decisions about buying and selling.

The high level of volatility and unpredictability of the crypto market makes using technical analysis difficult. The cryptocurrency market is still in its infancy, and a variety of factors, including regulatory developments, news and events, and technology advancements, can affect the price movements.
Therefore, in order to make wise trading and investment decisions, technical analysis should be combined with other types of analysis, such as fundamental analysis and market sentiment analysis.
What is Fundamental Analysis in Crypto?
In fundamental analysis, a cryptocurrency’s worth is assessed based on its basic characteristics, such as its technology, applications, community, adoption rate, and overall market conditions.
Fundamental analysis seeks to evaluate a cryptocurrency’s intrinsic value and establish whether it is overvalued or undervalued.
Researching a cryptocurrency’s development team, their past performance, and their future goals can be a part of fundamental analysis. Analyzing the whitepaper and comprehending the technical details of the coin, such as its scalability and consensus mechanism, can also be included.
In general, fundamental research is a crucial tool for investors who want to choose wisely while making crypto investments. It is crucial to remember that the crypto market may be extremely unpredictable and volatile, so investors should always do their research before investing.

What is market sentiment analysis in crypto?
Market sentiment analysis on the other hand involves evaluating the investors’ general emotional and psychological attitude toward a certain coin or the whole crypto market.
It seeks to understand whether investors are feeling optimistic or pessimistic about the market, and how this sentiment may influence prices and trading activity.
A variety of tools and approaches, including social media and news sentiment analysis, trading volume and price tracking, and general market trends and patterns analysis, can be used to analyze market sentiment. For instance, sentiment analysis may involve counting the number of comments on a specific cryptocurrency that have been made on social media sites like Twitter or Reddit, either positively or negatively.
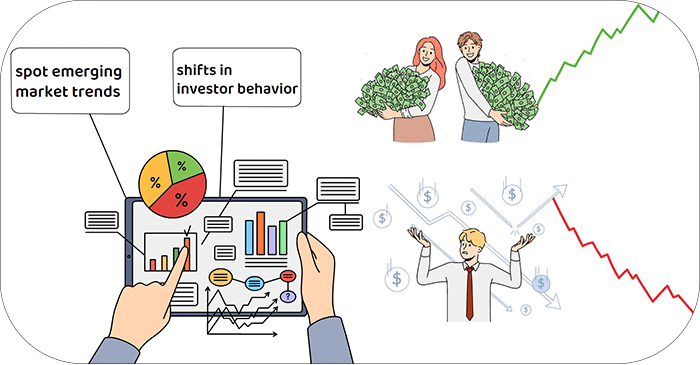
Making more educated investment decisions is the goal of market sentiment analysis, which aims to spot emerging market trends and shifts in investor behavior.
Price increases may be predicted if the attitude is predominantly favorable, whereas price decreases may be predicted if the emotion is negative.
To make well-rounded investment judgments, market sentiment analysis should be utilized in conjunction with other types of analysis, such as technical analysis and fundamental analysis.
Investors should approach sentiment analysis with caution and not rely primarily on it for making investment decisions because market sentiment may be very subjective and may not necessarily reflect the underlying fundamentals of a coin.

In conclusion, technical analysis is a technique for analyzing financial markets that involves looking at historical market data, especially price and volume data, to spot patterns, trends, and price moves.
While technical analysis can offer insightful information about the cryptocurrency market, it should be combined with other types of analysis to help technical analysts make well-informed decisions.
As the cryptocurrency market continues to evolve, technical analysis will likely play an increasingly important role in helping traders and investors navigate this rapidly changing market.